Telemetry Reports
How telemetry works
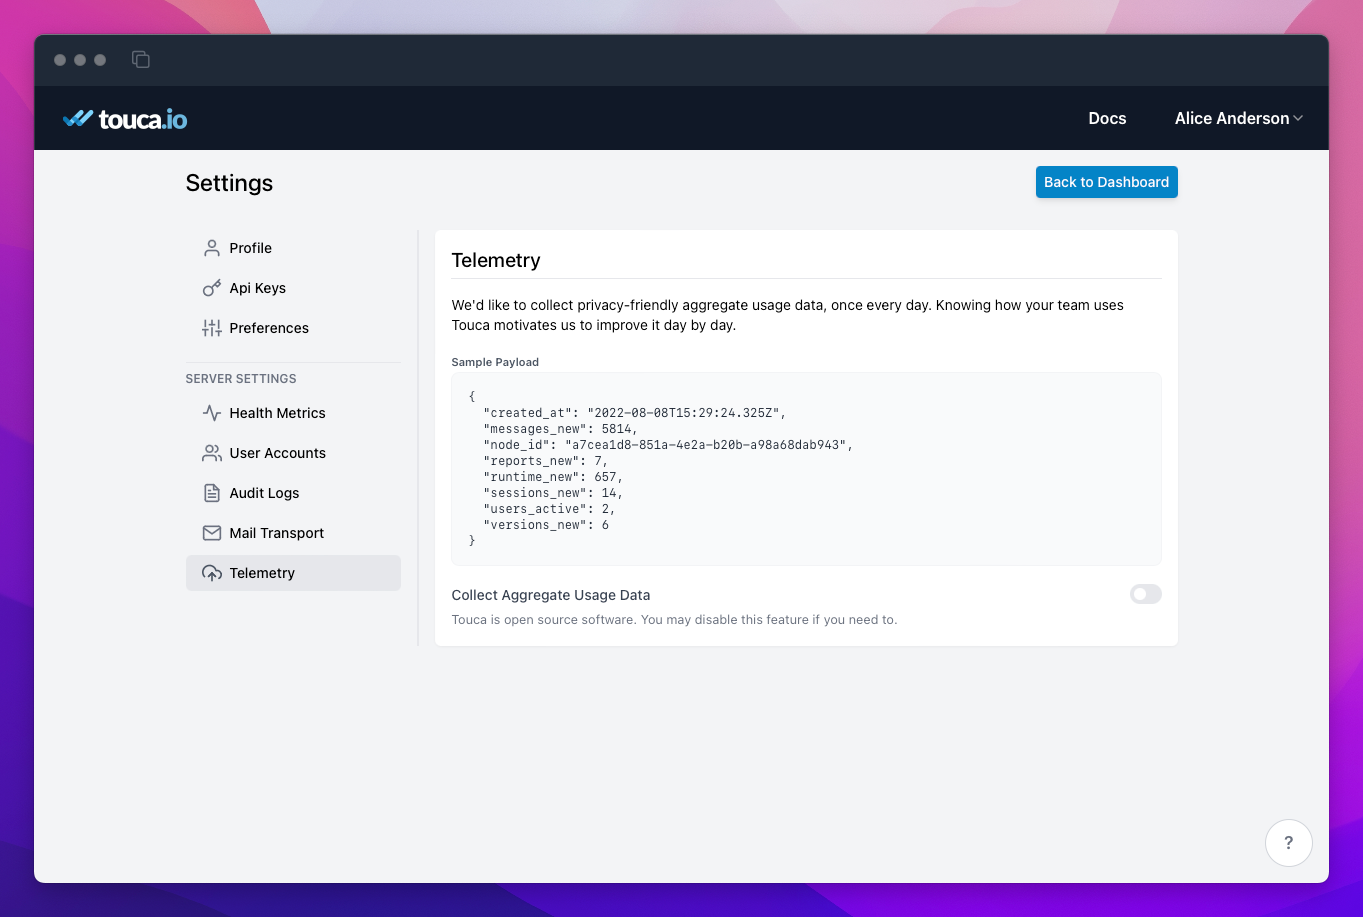
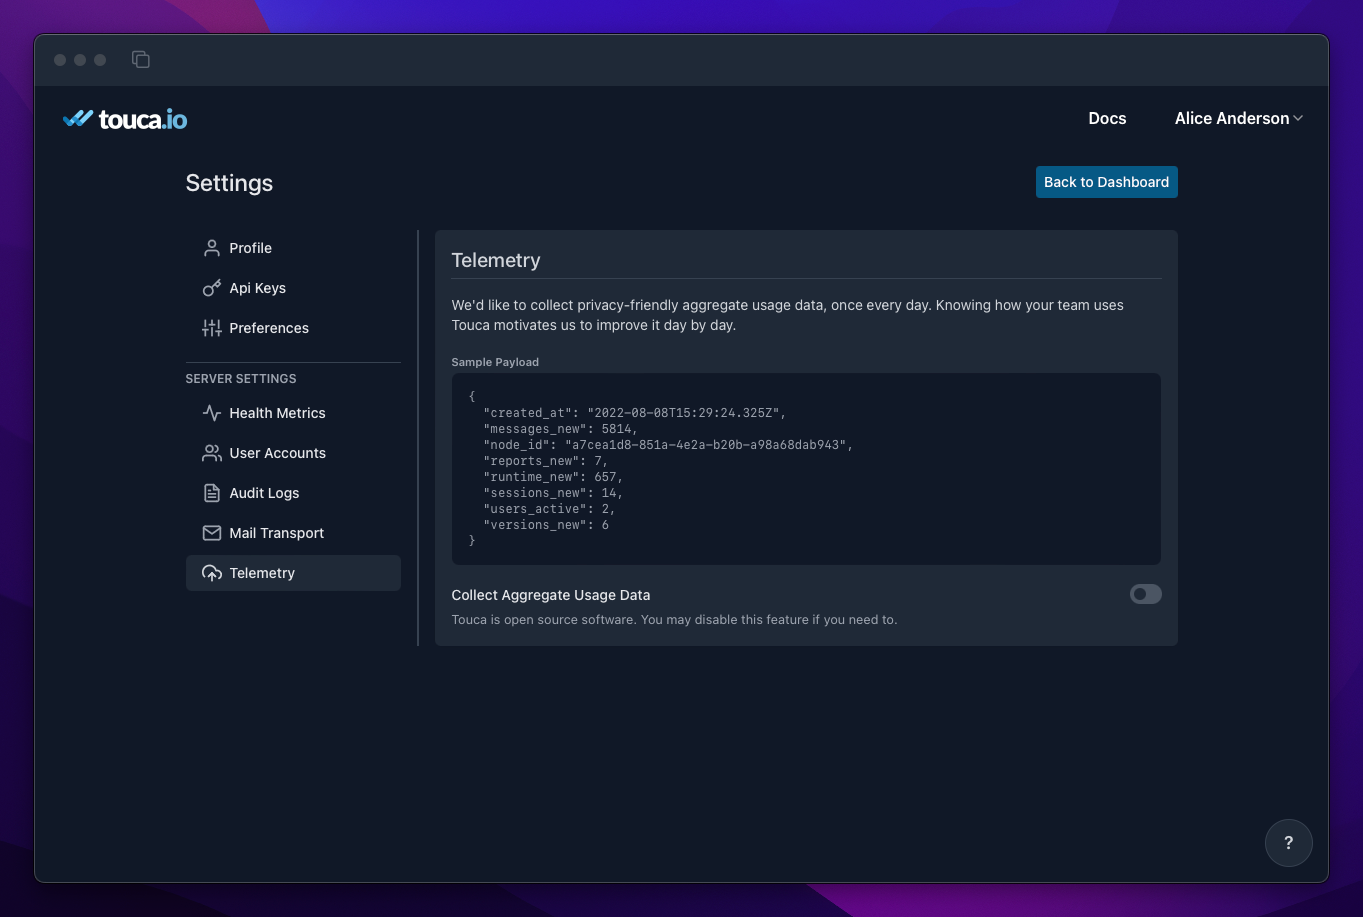
Self-hosted instances of Touca server have a telemetry service that runs once every day to collect anonymous usage data and to submit them to the Touca engineering team. Here is a sample telemetry report.
{
  "created_at": "2022-08-08T15:29:24.325Z",
  "messages_new": 5814,
  "node_id": "a7cea1d8-851a-4e2a-b20b-a98a68dab943",
  "reports_new": 7,
  "runtime_new": 657,
  "sessions_new": 14,
  "users_active": 2,
  "versions_new": 6
}
These usage reports help us get an understanding of how our product is being used by people around the world. We also use this data to derive KPIs that help us measure the success of our business as a software company.
Touca Telemetry Service is enabled by default, but you can disable it at any time and for any reason. By giving you the option to disable this service and being transparent about how it works, we hope to earn your trust and convince you to leave Telemetry enabled.
What data is collected
Here are all the data that the telemetry service collects when it is enabled:
messages_new: Total number of newly submitted messages since the last generated report.reports_new: Total number of non-administrative emails generated and sent by the server, such as emails that notify you about the differences found in a newly submitted version.runtime_new: Aggregate runtime duration in seconds of all newly submitted versions since the last generated report.sessions_new: Total number of user sessions created since the last generated report.users_active: Total number of unique users who logged in to your server instance since the last generated report.versions_new: Total number of newly submitted versions since the last generated report.
Each telemetry report also includes:
created_at: Date and time when the report is generated.node_id: Unique identifier of your server instance. This value helps us measure if your team's daily usage of Touca grows over time.
Disabling telemetry
You can disable telemetry from the Settings page, under the Telemetry tab in the Server Settings section. You must be logged in as the server owner (the user account you creating during Touca server installation) in order to access this tab.